
Cass Freight Index: Navigating the 2026 Rate-Volume Paradox in North American Freight
Cass Freight Index reveals a 2026 paradox: declining volumes but rising rates. Capacity constraints drive higher costs for shippers.
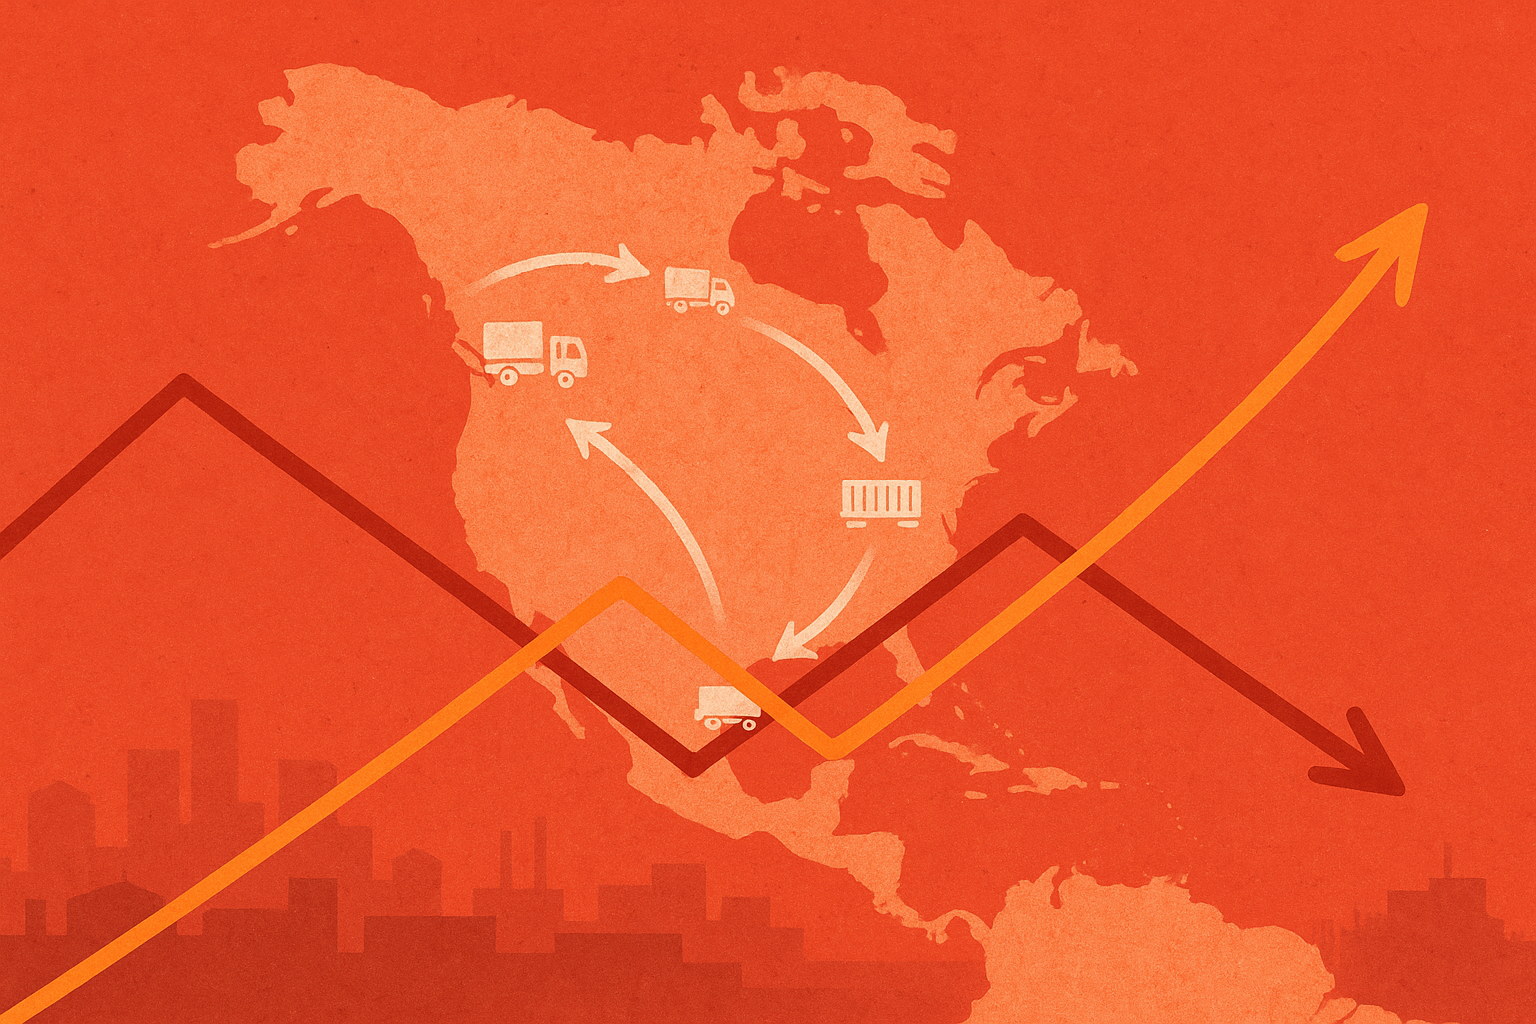
In February 2026, the Cass Freight Index showed that North American freight shipments dropped by 7.1% from last year, but costs went up by 2.1%. This happened because there are fewer trucks and drivers, making shipping more expensive even though there is less stuff to move. The market is struggling with high rates and low volumes, which is different from normal times when both usually rise or fall together. Many small trucking companies have closed, making it harder to find enough trucks, so prices keep climbing. Experts say this could mean higher shipping costs throughout 2026 unless demand for freight starts to grow again.
What does the February 2026 Cass Freight Index reveal about North American freight trends?
The February 2026 Cass Freight Index highlights a unique freight market: shipment volumes dropped 7.1% year-over-year, yet total freight expenditures rose 2.1%. This "rate-volume paradox" signals that tight capacity and carrier exits are driving higher rates despite lower demand, impacting freight budgets in 2026.
The February 2026 Cass Freight Index revealed a complex freight landscape where declining volumes met rising costs, signaling a pivotal shift in North American transportation markets. While shipments dropped 7.1% year-over-year to an index level of 0.978, the month-over-month surge of 10.4% demonstrated recovery from weather-related disruptions that had suppressed January activity.
The Rate-Volume Paradox
The most striking feature of February's data was the divergence between volume and expenditure trends. Despite fewer shipments moving through the system, total freight expenditures climbed 2.1% year-over-year, reaching an index of 3.143. This seemingly contradictory pattern reveals an underlying rate environment that has strengthened considerably - with the implied freight rate increase reaching approximately 9.2% when comparing expenditure growth against volume declines.
The Cass Truckload Linehaul Index advanced to 146.3, marking a 2.2% year-over-year gain and establishing a new cycle high at 4.1% above levels from two years prior. This metric, which tracks linehaul costs exclusive of fuel surcharges and accessorial charges, provides clear evidence that base truckload rates have firmed substantially after years of decline.
Historical Context of Market Volatility
To understand the significance of February's numbers, consider the freight expenditure rollercoaster of recent years. The market experienced explosive growth of 38% in 2021 and 23% in 2022 as pandemic-related disruptions created unprecedented capacity constraints. The subsequent correction proved equally dramatic: expenditures fell 19% in 2023 and 11% in 2024, with truckload rates declining 10% and 3.4% respectively during those years.
The year 2025 represented a stabilization point, with overall expenditures down just 0.5% while truckload rates managed a modest 1.8% gain. This set the stage for 2026's emerging rate strength, where early-year data shows truckload rates climbing 3.2% year-over-year despite challenging weather conditions in January.
Capacity Constraints Drive Rate Momentum
Early March indicators pointed to persistent tightness in spot capacity, creating conditions favorable for continued rate acceleration. Industry analysis from ACT Research noted that supply-driven market tightening was pushing truckload contract rates into mid-single-digit percentage increases - the first such movement in over four years of rate weakness.
The combination of reduced carrier capacity and firming demand created a market dynamic where rates could advance even without significant volume growth, marking a fundamental shift from the oversupplied conditions of 2023-2024.
Several factors contributed to this capacity constraint environment:
- Continued carrier exits following the 2022-2024 freight recession
- Regulatory pressures affecting driver availability
- Equipment utilization challenges stemming from uneven geographic demand
- Financial stress limiting fleet expansion among surviving carriers
Seasonal Patterns and Forward Indicators
| Month | Shipments Index | YoY Change | MoM Change | Expenditures YoY |
|---|---|---|---|---|
| January 2026 | 0.886 | -7.1% | -4.9% | +0.6% |
| February 2026 | 0.978 | -7.1% | +10.4% | +2.1% |
| March 2026 | 1.007 | -4.5% | +3.0% | +4.2% |
The progression from January through March illustrated typical seasonal recovery patterns, though with volumes still running below prior-year levels. The March report showed expenditures accelerating to 4.2% year-over-year growth, suggesting rate momentum was building rather than plateauing. Meanwhile, the Truckload Linehaul Index dipped 0.5% month-over-month in March, potentially signaling the start of a rate plateau after seven consecutive months of increases.
Seasonally adjusted data told a similar story - February's 4.3% month-over-month shipment gain (after adjustment) recovered much of the weather-related weakness from the prior two months. This brought seasonally adjusted rates to levels that, if sustained, would project approximately 1.5% year-over-year growth by year-end.
Implications for Supply Chain Stakeholders
The February Cass Freight Index data carries important implications for shippers, carriers, and logistics providers navigating 2026 market conditions. For shippers, the combination of modest volume growth and accelerating rates suggests that freight budgets may face upward pressure in the quarters ahead, particularly if spot capacity remains constrained.
Carriers that survived the 2022-2024 downturn are now positioned to benefit from improved pricing power, though volume uncertainty remains a concern for revenue stability and network optimization.
The index, which has tracked North American for-hire freight activity since 1995 based on Cass Information Systems' extensive client invoice processing, serves as a leading indicator for broader economic activity. The current pattern of declining volumes with rising rates differs from typical recovery scenarios, where volume and rate improvements move in tandem. This suggests the market is experiencing a supply-led tightening rather than demand-driven growth.
Looking toward the second quarter of 2026, the combination of tight spot capacity, firming contract rates, and potential seasonal demand improvements creates conditions for continued rate strength. However, the sustainability of this pricing environment depends heavily on whether freight volumes can transition from weather-impacted volatility to genuine demand growth - a question that remains open as spring shipping season approaches.